Frequency Distribution


Frequency Distribution
Frequency:
The number of times a particular observation occurs in a given data is called its frequency of an observation.The observation having maximum frequency is known as mode.
Illustration: In a data 7,6,5,5,4,3,2,2,5,1,3 find the frequency of 5.
Solution: Here the frequency of 5 in this data is 3.
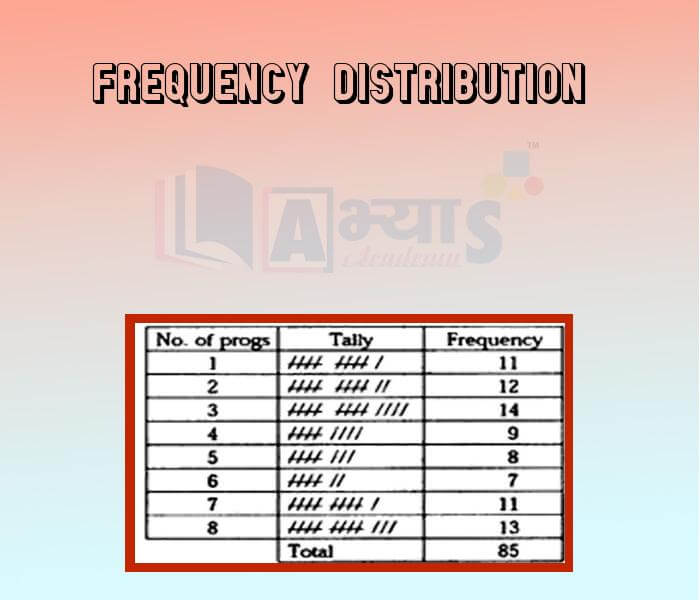
Frequency Distribution:
The tabular arrangement of data sharing their corresponding frequencies is called a frequency distribution. Frequency tells you how often something happened. The frequency of an observation tells you the number of times the observation occurs in the data.
A random survey of numbers of children of various age group playing in a park was found as follows. Children playing between the age group of 5-7 years are:
| |||||||||||||||||||
| Right Option : C | |||||||||||||||||||
| View Explanation | |||||||||||||||||||
A group of 20 participants entered a quiz competition. Their scores are given in the table below. Calculate the percentage of the participants who scored more than 2 points.
| |||||||||||||||
| Right Option : C | |||||||||||||||
| View Explanation | |||||||||||||||
Find the frequency of Class 100-120 by using the given data:
| |||||||||||||||||
| Right Option : C | |||||||||||||||||
| View Explanation | |||||||||||||||||
Students / Parents Reviews [10]
It has a great methodology. Students here can get analysis to their test quickly.We can learn easily through PPTs and the testing methods are good. We know that where we have to practice

Barkha Arora
10thMy experience with Abhyas is very good. I have learnt many things here like vedic maths and reasoning also. Teachers here first take our doubts and then there are assignments to verify our weak points.

Shivam Rana
7thAbhyas Methodology is very good. It is based on according to student and each child manages accordingly to its properly. Methodology has improved the abilities of students to shine them in future.

Manish Kumar
10thBeing a parent, I saw my daughter improvement in her studies by seeing a good result in all day to day compititive exam TMO, NSO, IEO etc and as well as studies. I have got a fruitful result from my daughter.
Prisha Gupta
8thI have spent a wonderful time in Abhyas academy. It has made my reasoning more apt, English more stronger and Maths an interesting subject for me. It has given me a habbit of self studying

Yatharthi Sharma
10thMy experience with Abhyas academy is very good. I did not think that my every subject coming here will be so strong. The main thing is that the online tests had made me learn here more things.

Hiya Gupta
8thOne of the best institutes to develope a child interest in studies.Provides SST and English knowledge also unlike other institutes. Teachers are co operative and friendly online tests andPPT develope practical knowledge also.

Aman Kumar Shrivastava
10thAbhyas is a complete education Institute. Here extreme care is taken by teacher with the help of regular exam. Extra classes also conducted by the institute, if the student is weak.

Om Umang
10thA marvelous experience with Abhyas. I am glad to share that my ward has achieved more than enough at the Ambala ABHYAS centre. Years have passed on and more and more he has gained. May the centre flourish and develop day by day by the grace of God.

Archit Segal
7thIt was a good experience with Abhyas Academy. I even faced problems in starting but slowly and steadily overcomed. Especially reasoning classes helped me a lot.